Sir if the graph dont provide the data of the respective departments in each bar. Like we know 3 was from x but in bar graph its not mentioned which is x. Then how will we use the graphs to obtain that.
I’m afraid I didn’t get your question? Where is 3 coming into the picture? The 6 comes from the initial information (which tells us that there are 6 people in Ops at the start)
Huh? If you remove the info how will you find that out? It would no longer be a valid question even! The info is given in the original question because it is needed. Without that, even guessing would be painful.
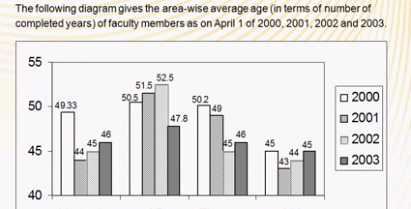
Just see that last bar graph
In 2000
45 should go to 46 If same guys
but Its 43
So it means 46-25 21 and differences in average is of 3
so 7 in 2001 last year 6 thats what i meant.
We can still find out i guess.
Yes, at some point in the past few years the link seems to have gotten broken. So, I had tried my hand at DI videos for a couple of months but was not too satisfied with the result tbh, hence did not make the effort to re-upload (nor do i plan to). There is enough better content out there for DILR, so I have focused on QA since.

Sir if the graph dont provide the data of the respective departments in each bar. Like we know 3 was from x but in bar graph its not mentioned which is x. Then how will we use the graphs to obtain that.
I’m afraid I didn’t get your question? Where is 3 coming into the picture? The 6 comes from the initial information (which tells us that there are 6 people in Ops at the start)
regards
J
I meant what if i change the question:
Just in the graph
So how will u find out ops which has 6 guys is in which data. Thats what calculation i did above on difference.
For OM
46-25= 3 (gap)
Will help to obtain 7
That means 6 last year
This is correct approach?
Huh? If you remove the info how will you find that out? It would no longer be a valid question even! The info is given in the original question because it is needed. Without that, even guessing would be painful.
regards
J
Just see that last bar graph
In 2000
45 should go to 46 If same guys
but Its 43
So it means 46-25 21 and differences in average is of 3
so 7 in 2001 last year 6 thats what i meant.
We can still find out i guess.
Hi J,
Will you put some more insight into data interpretation?
The videos seem to be deleted/unavailable on Youtube.
Yes, at some point in the past few years the link seems to have gotten broken. So, I had tried my hand at DI videos for a couple of months but was not too satisfied with the result tbh, hence did not make the effort to re-upload (nor do i plan to). There is enough better content out there for DILR, so I have focused on QA since.
regards
J